
Click on INSERT tab
Select the required chart type
In this example i am selecting CYLINDER type chart
The Movement when i click on chart type CYLINDER, chart box will display on screen
Click on SELECT DATA
"Select Data Source" dialogue box will display on screen
Click on ADD to add the data for Vertical Axis
"Select Data Source" dialogue box will display on screen
Click on ADD to add the data for Vertical Axis
If we click on ADD(above step), "EDIT SERIES" dialogue box will display on screen
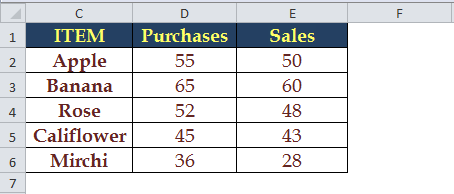
First i would like to add PURCHASES data
Fill the fields with required data
Now "Purchases" data has been succesfully added on chart
If we have more than one series, again click on ADD
In this context i have second series data also, named as SALES
Now click on ADD again
Now enter the SALES data in required field
Now vertical axis data PURCHASES & SALES successfully updated
Through this setp we have to update HORIZONTAL axis data
Click on EDIT
Select the data for HORIZONTAL
Now data for HORIZONTAL has been updated
Here is the final screen shot of SELECT DATA SOURCE
Here is the final step in charting process
We can edit this chart based on our requirement by using CHARTING TOOLS
Explain the procedure to create the chart?

Note:against the "series Name" field instead of typing "purchases" as header name, it is advised to place a cell reference. It gives dynamisam for chart.