

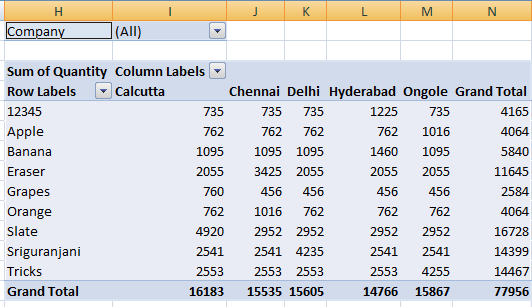
- It is very much useful to summarise the data
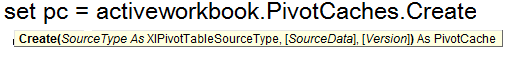
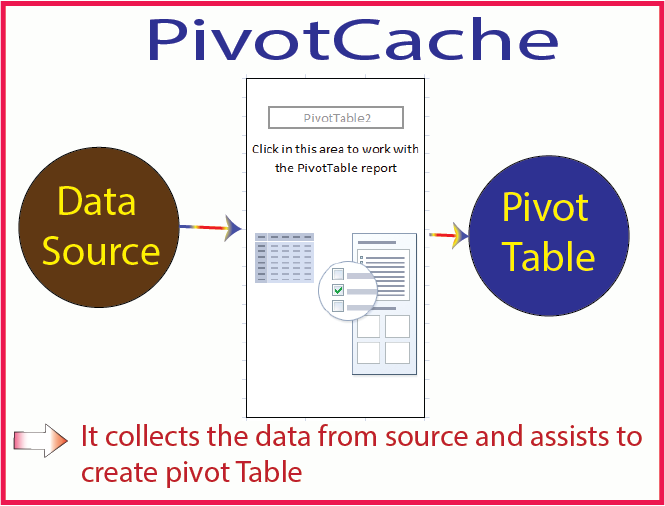
- PIVOTCACHE Method is used to store the memory of the pivot table
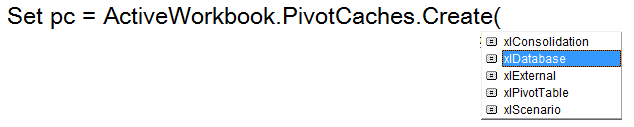
- CREATE METHOD is used to create pivotcache
- Advantage of creation of PIVOTCACHE is, we can create multiple reports with same sourcedata
- Columns in the Data Source referred as PIVOT FIELDS
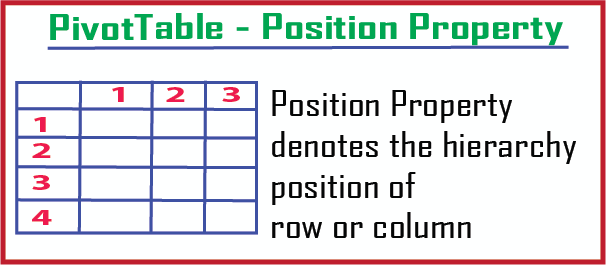
- POSITION PROPERTY: denotes about position of the field
- ORIENTATION: denotes about "hierarchy"
- PIVOT TABLE WIZARD method is not applicable to OLE DB data source
- We can create PIVOT TABLE either from a DATA BASE or LIST OF DATA
- We can canosider the data from:
- is a collection of PIVOT TABLE in a Worksheet
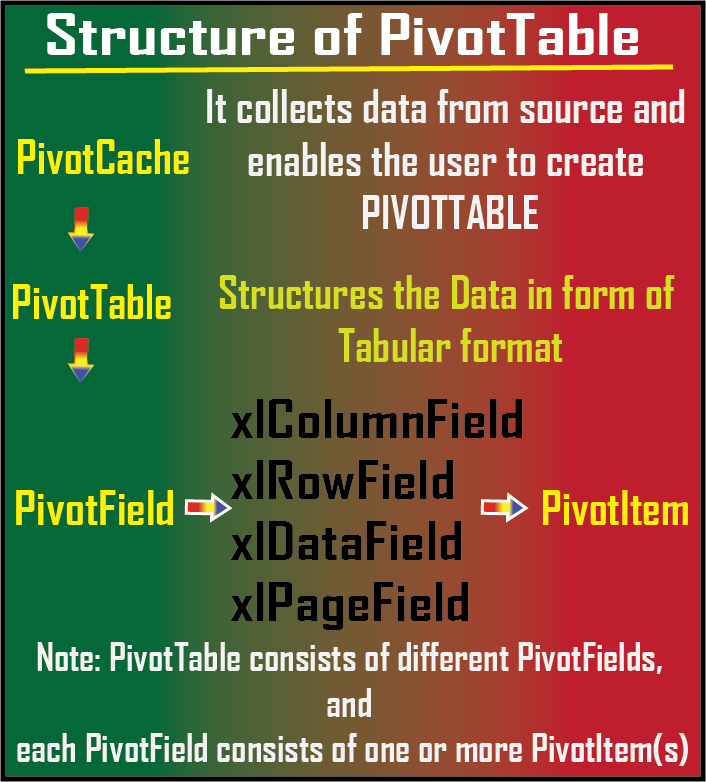
- Fields in a PIVOTTABLE
- Xlrowfield,xlcolumnfield,xlpagefield..
- These are part of PIVOTFIELDS
- Also termed as Headers of table\Database
- Each PivotTable consists of one or more PIVOTITEMS
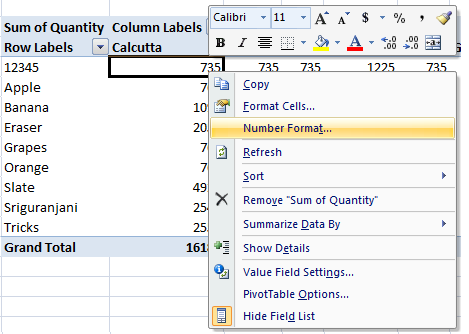
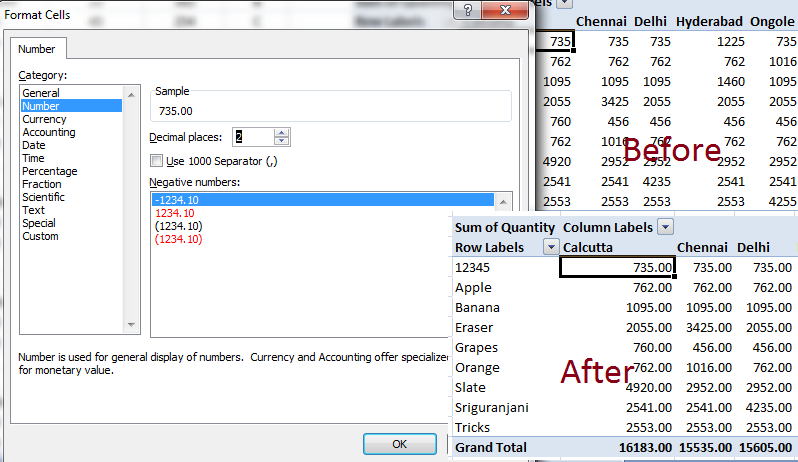
- Right click on cell in FILED SETTINGS
- Increased decimals to 2 zeros
Pivot Table
Structure of PIVOTTABLE:
Source for Pivot table:
(i)either from worksheet (or)
(ii) from external source
PIVOTTABLES:
PIVOTFIELDS:
Pivot table summaries large amount of data , in one or more columns as per our requirement called PIVOT FIELDS.
PIVOTITEMS:


Create Pivot Table
Click on image to watch the video

Public PC As PivotCache, PV As PivotTable, SH As Worksheet
Function InputSH()
Set SH = ThisWorkbook.Sheets("InputData")
End Function
Function LastRowFromBottom()
LastRowFromBottom = SH.Range("A" & Rows.Count).End(xlUp).Row
End Function
Function CreatePivotCatche()
Set PC = ThisWorkbook.PivotCaches.Create(SourceType:=xlDatabase, SourceData:=SH.Range("A1:F" & LastRowFromBottom))
End Function
Function Create_PivotTable()
Set PV = PC.CreatePivotTable(TableDestination:=SH.Range("H3"), TableName:="Sales")
End Function
Function Define_PivotTable()
Set PV = SH.PivotTables("Sales")
End Function
Sub CreatePivotTable()
InputSH
CreatePivotCatche
Create_PivotTable
ThisWorkbook.ShowPivotTableFieldList = True
PV.PivotFields("Item").Orientation = xlColumnField
PV.PivotFields("Location").Orientation = xlRowField
PV.PivotFields("Zone").Orientation = xlPageField
With PV.PivotFields("Qty")
.Orientation = xlDataField
.Function = xlSum
End With
End Sub
Sub ClearTable()
InputSH
Define_PivotTable
PV.ClearTable
SH.Columns("G:L").Clear
End Sub

Create Pivot Table - without creating functions
Private Sub CommandButton1_Click()
Dim ds As Range
Set ds = Range("A1").CurrentRegion
Dim pc As PivotCache
Set pc = ActiveWorkbook.PivotCaches.Create(xlDatabase, ds)
Dim Pv As PivotTable
Set Pv = pc.CreatePivotTable(Range("H3"), tablename:="information")
With Pv
.PivotFields("Item").Orientation = xlRowField
.PivotFields("location").Orientation = xlColumnField
.PivotFields("Company").Orientation = xlPageField
With .PivotFields("Quantity")
.Orientation = xlDataField
.Function = xlSum
End With
End With
Range("H3").CurrentRegion.Columns.AutoFit
End Sub

Display Pivot fields
Private Sub CommandButton2_Click()
With Sheets("sheet2").PivotTables(1)
r = 29
For i = 1 To .PivotFields.Count
MsgBox .PivotFields(i).Name
Range("h" & r).Value = .PivotFields(i).Name
r = r + 1
Next
End With
End Sub
Pivot Table Creation
Private Sub CommandButton1_Click()
Dim pvt As PivotTable, datasource As Range
Set datasource = ThisWorkbook.Sheets("sheet2").Range("A1").CurrentRegion
SourceData:=datasource, TableDestination:=Sheets("Sheet2").Range("I8"))
ActiveWorkbook.ShowPivotTableFieldList = False
.PivotFields("Item").Orientation = xlRowField
.PivotFields("location").Orientation = xlColumnField
.PivotFields("price").Orientation = xlColumnField
.PivotFields("Company").Orientation = xlPageField
With pvt.PivotFields("Quantity")
.Orientation = xlDataField
.Function = xlSum
End With
End With
End Sub
Pivot Table - Record Macro
Sub PivotTable_Record_Macro()
'
' PivotTable_Record_Macro Macro
Range("A1").Select
ActiveWorkbook.PivotCaches.Create(SourceType:=xlDatabase, SourceData:= _
"Sheet2!R1C1:R151C6", Version:=xlPivotTableVersion12).CreatePivotTable _
TableDestination:="Sheet2!R8C8", TableName:="PivotTable3", DefaultVersion _
:=xlPivotTableVersion12
Sheets("Sheet2").Select
Cells(8, 8).Select
With ActiveSheet.PivotTables("PivotTable3").PivotFields("Item")
.Orientation = xlRowField
.Position = 1
End With
With ActiveSheet.PivotTables("PivotTable3").PivotFields("Company")
.Orientation = xlColumnField
.Position = 1
End With
ActiveSheet.PivotTables("PivotTable3").AddDataField ActiveSheet.PivotTables( _
"PivotTable3").PivotFields("Quantity"), "Sum of Quantity", xlSum
With ActiveSheet.PivotTables("PivotTable3").PivotFields("Location")
.Orientation = xlPageField
.Position = 1
End With
ActiveSheet.Shapes.AddChart.Select
ActiveChart.SetSourceData Source:=Range("Sheet2!$H$8:$N$19")
ActiveWorkbook.ShowPivotChartActiveFields = True
ActiveChart.ChartType = xlColumnClustered
ActiveWorkbook.ShowPivotChartActiveFields = True
End Sub
Pivot Table & Pivot Chart
Private Sub CommandButton1_Click()
Dim Pv As PivotTable
Dim pc As PivotCache
Dim ds As Range
Set ds = Range("A1").CurrentRegion
Set pc = ActiveWorkbook.PivotCaches.Create(xlDatabase, ds)
Set Pv = pc.CreatePivotTable(Range("H3"))
ActiveWorkbook.ShowPivotTableFieldList = True
' Add fields to the PivotTable
With Pv
.PivotFields("Item").Orientation = xlRowField
.PivotFields("Quantity").Orientation = xlColumnField
With .PivotFields("Quantity")
.Orientation = xlDataField
.Function = xlSum
End With
End With
Range("H3").CurrentRegion.Columns.AutoFit
End Sub
Private Sub CommandButton2_Click()
Dim shap As Shape
Set shap = ThisWorkbook.Sheets("Sheet2").Shapes.AddChart(xlColumnClustered)
Dim chsource
shap.Chart.SetSourceData Source:=ThisWorkbook.Sheets("Sheet2").PivotTables(1).TableRange1, PlotBy:=xlColumns
' to fit the chart in specified range
Range("I30:R40").Select
With Selection
'shap.Left = Range("I30:R40").Left
shap.Left = .Left
shap.Height = .Height
shap.Top = .Top
shap.Width = .Width
End With
End Sub
Pivot Table - Number format
Pivot Table Number format - Percentage

Private Sub CommandButton2_Click() ActiveSheet.PivotTables("information").PivotSelect "Delhi", xlDataAndLabel, True Selection.NumberFormat = "0.00%" Columns("J:J").ColumnWidth = 13.29 End Sub
Pivottable - Select & Delete
Private Sub CommandButton3_Click()
ActiveSheet.PivotTables("information").PivotSelect "", xlDataAndLabel, True
Selection.ClearContents
End Sub
 Hi Everyone,
Welcome to VBA Macros Tutorial. This Tutorial provides comprehensive knowledge on VBA Macros to the user.
Hope it enhances your coding skills. If you like this web page kindly Share this to your near and dear.
I Prepared this content as per my level of knowledge, if any changes required kindly bring to my notice. Thanks for visiting this web page
Thanks,
Pavan Kumar Gundlapalli