

- remove duplicates on a particular column
- Adjust the remaining columns based on duplication applied column
- It removes duplicate values and returns unique values
- It returns whether a particular column is duplicate or not
- If the row is duplicate, it returns TRUE, else returns FALSE
- del df['columnHeader']
- print(len(df))
- print(df.shape)
- print(df.dtypes)
- print(df.columns)
- print(list(df.columns))
- df.rename(columns = {'sales' : 'salePrice', 'purchase' : 'purchasePrice'}, inplace=True)
- print(df.columns)
- print(df.info())
- print(df.drop('sales', axis=1).head(11))
- df.drop(['Sales', 'Purchase'], axis=1, inplace=True)
- df.dropna()
- df.dropna(axis=1)
- df.dropna(axis=1,thresh=100)
- df.fillna(1500)
- df.fillna(df.std())
- df['Sales'].astype(float)
- print(df.ix[1])
- print(df.ix[:])
- print(df.ix[0:4])
- print(df.ix[1:5,['Price']])
- print(df.ix[0:3,['Symbols','Price']])
- print(df.ix[::2])
- print(df.ix[1,6])
- df1 = df.ix[[1,5]]
- df1 = df.ix[[1,5],['Open', 'Low']]
- print(df1)
- print(df.ix[[4,8,3,1]])
- print(df.iloc[1:4])
- print(df.iloc[0:4])
- print(df.iloc[[1,5,4,8,2]])
- print(df.iloc[1:4, 6:9])
- print(df.loc[[1,8,3,4],['Price','sales']])
- print(df.loc[:5,'Price':'sales'])
- print(df.loc[5:,'sales':])
- print(df.loc[3:8,['Sales','Price','Purchases']])
- RowNumbers = [1,5,8,4,3]
- ColumnNumbers = ['Sales','Purchases','Expenses','Profit']
- print(df.loc[RowNumbers,ColumnNumbers])
- print(df.describe())
- print(df['Sales'].describe())
- print(df.mean())
- print(df.corr())
- It considers non null values
- print(df.max())
- print(df.min())
- print(df.median())
- print(df.std())
- It appends the second dataframe at the end of first dataframe
- Columns should be same
- It appends the second dataframe after first dataframe
- Rows should be same
- df.replace(100,'five')
- df.replace([15,28,34],['first','second','Third'])
- df.rename(columns={'old_name': 'new_name'})
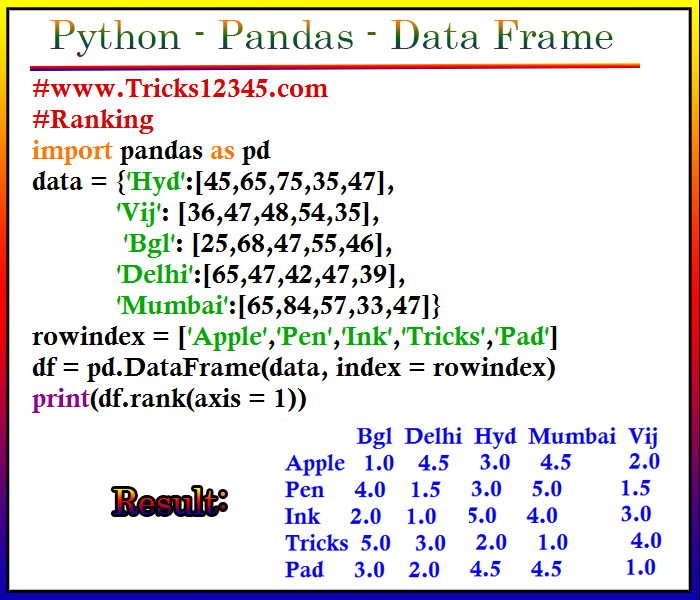
Ranking

Remove Duplicates - on a column
import pandas as pd
rows = [(14,15,16),(14,18,22),(22,18,17),(14,18,22)]
headers=['Apple','Banana','Grapes']
df = pd.DataFrame(rows, columns = headers)
print(df)
q = df.drop_duplicates(['Apple'])
print(q)
Duplicate particular row
import pandas as pd
rows = [(14,15,16),(14,18,22),(22,18,17),(14,18,22)]
headers=['Apple','Banana','Grapes']
df = pd.DataFrame(rows, columns = headers)
q = df.duplicated()
print(q)
Add a column to DataFrame with amount
import pandas as pd
df = pd.DataFrame([5,6], index = ['apple','banana'])
df['grapes']=35
print(df)
Add serial number to the newly created
import pandas as pd
import numpy as np
df = pd.DataFrame([5,6], index = ['apple','banana'])
df['grapes']=np.arange(2)
print(df)
Delete a column
import pandas as pd
df = pd.DataFrame([5,6,7,6], index = ['apple','banana','orange','Grapes'])
df1 = df.reindex(['apple','Grapes','orange','banana'])
print(df1)
Data Extraction
Note:df.ix was Depricated

Basic Info
Returns number of rows
Rows in first column
FirstcolumnRows = df[df.columns[0]]
rowscount = FirstcolumnRows.count()
print(rowscount)
Returns rows and columns of dataframe
Returns data type of each column
Print the columns
Print columns in a List
rename a column name and keep in same place
Print the columns
Provides the information about the data frame
drop a column
Drop a column and print the remaining dataframe
Drops all rows that consists of null values
Drops all columns consists of null values
Drops all the rows having less than value 100
Fill null values with 1500
Fill null values with std
Converts the data type to float
ix

Print row as series
Print all rows
Print First five rows
Print five rows from second row of PRICE column
Print First four rows of PRICE and SYMBOLS columns
Print Every alternate row, 0,2,4,6....
Print second row and 7th column value
Create new dataframe with second and 6th rows and print the result
Create new data frame with second and 6th columns and Open and Low columns
Print rows without order
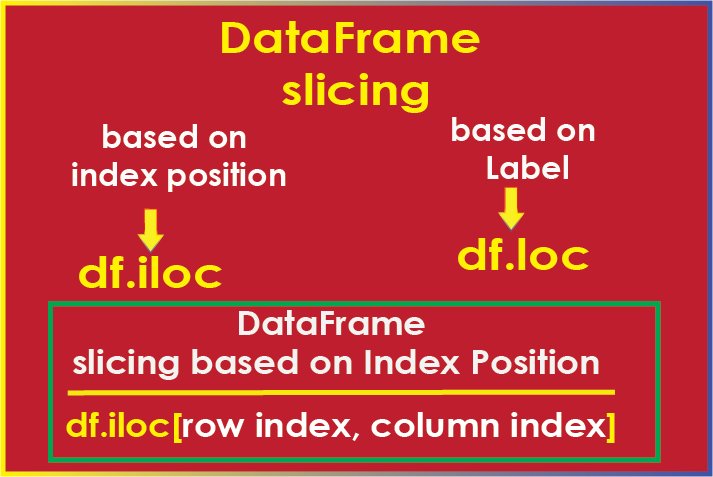
iloc
rows count starts from zero
Print 1,2,3 rows
Print 0,1,2,3 rows
Print rows without order\sequence
Print 1,2,3 rows and 6,7,8 columns
loc
Print required rows and columns
Print upto 5(0,1,2,3,4,5) rows with columns range
From 5th row to last row and from sales column to last column
Range of rows and defined columns
Store the row numbers and column numbers into variables
change the column data based on headers
df['Symbols'] = 'Hello'
df['Open'] = 180
print(df)
Filtering the data
Rows greater than 1500 in sales column
df1 = df[df['sales'] > 1500]
print(df1)
Print range values - between Min and Max
df1 = df[(df['Sales'] > 1500) & (df['Sales'] < 3000)]
print(df1)
Sort the column values
df1 = df.sort_values('Sales')
print(df1['Open'].head())
Sort the column values in descending order
df1 = df.sort_values('Open',ascending=False)
print(df1['Open'].head())
Change the order of a column permanently
df.sort_values('Open',ascending=False, inplace=True)
print(df['Open'].head())
Statistics
Denotes about the summary of statistics for the numerical column
To a particular column
Mean to all the columns
Returns correlation between the columns in dataframe
Returns count to all the columns\ required columns of data frame
print(df.count())
print(df['Symbols'].count())
Returns max value to all the columns in dataframe
Returns min value to all the columns in dataframe
Returns median to each column of dataframe
Returns standard deviation to each column of dataframe
Append\Join
df1 = df['Symbols'].head(6)
df2 = df['Symbols'].tail(3)
print(df1.append(df2))
df1 = df['Symbols'].head(6)
df2 = df['High'].head(3)
print(pd.concat([df1, df2],axis=1))
Join Types

df1 = print(df.ix[1:5,['Symbols','High']])
df2 = print(df.ix[1:5,['Symbols','LTP']])
print(df1.join(df2,on='Symbols',how='Left'))
Replace
Replace hunderd with five
replace 15 with first, 28 with second, 34 with third
Rename a column
Text Files
df = pd.read_csv('sales.txt')
data.to_csv('static/sales.csv')
print(df)
 Hi Welcome to Python Tutorial.
Thanks,
Pavan Kumar Gundlapalli